

Goal:
Creating an intelligent agent for automated technical analysis of stock and cryptocurrency charts that provides users with analytical summaries, visualizations and forecasts based on market data, without explicit financial recommendations.
Scope of application:
Use in trading and investment to analyze market trends, identify key levels of support/resistance, interpret indicators (MACD, Volume) and teach users financial concepts in an accessible form.
How does this work?
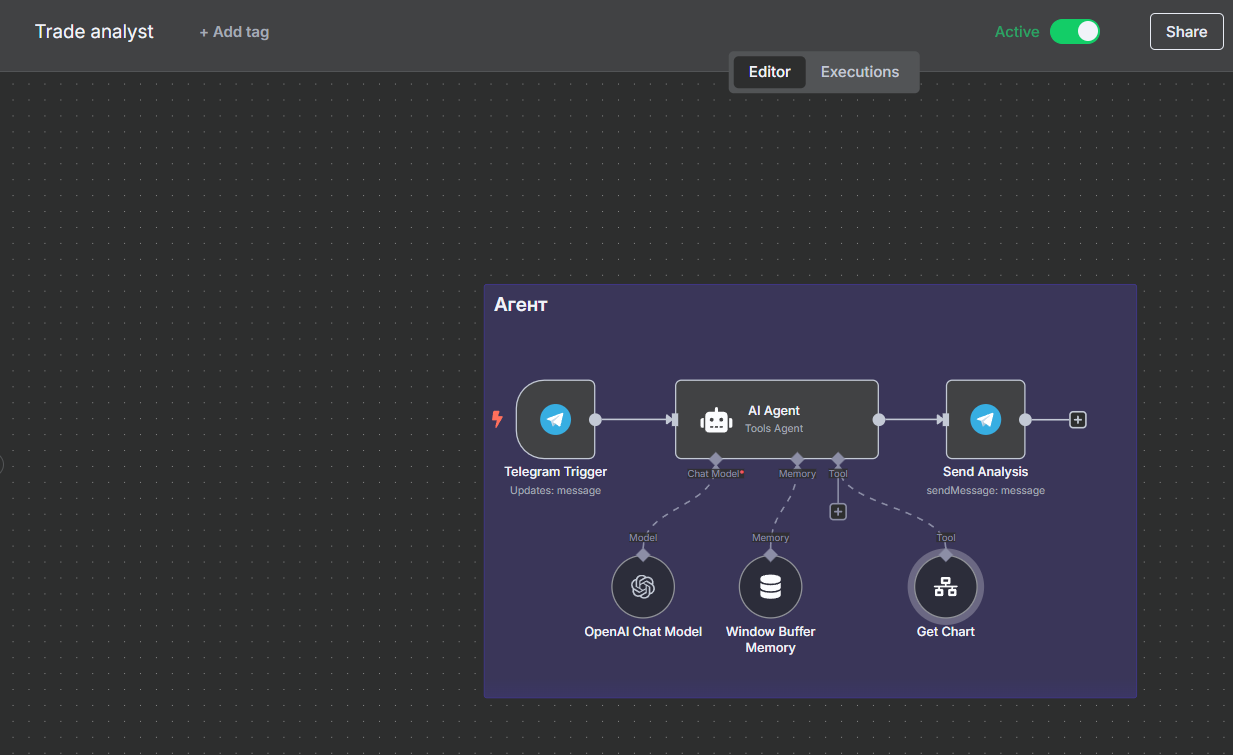
This automation in N8N is an intelligent agent designed to analyze cryptocurrency and stock charts at the user's request. The system uses artificial intelligence to obtain, process and interpret market data, providing brief analytical summaries, visualizations and forecasts. Automation allows the user to send requests in a free form, and in response, the AI agent provides analysis based on technical indicators, price dynamics and market trends, providing a deeper understanding of the current market situation.
For this automation, you will need:
- OpenAI API key https://platform.openai.com/settings/profile/user
- Chart-img API key https://chart-img.com/
- Create a telegram bot via @Botfather
First of all, we create or insert a ready-made template for the agent himself
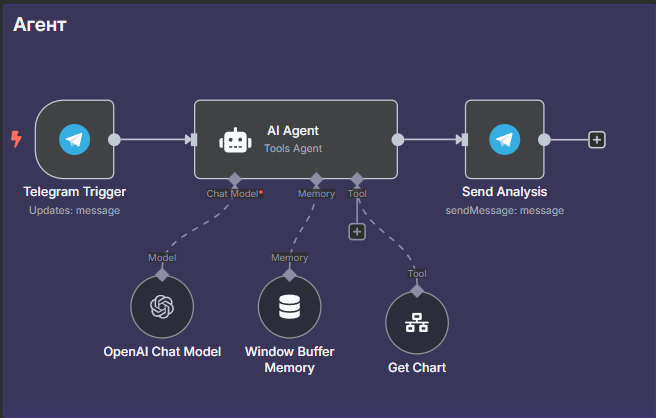
Create a Telegram trigger on message

Create a bot on Telegram on Botfather
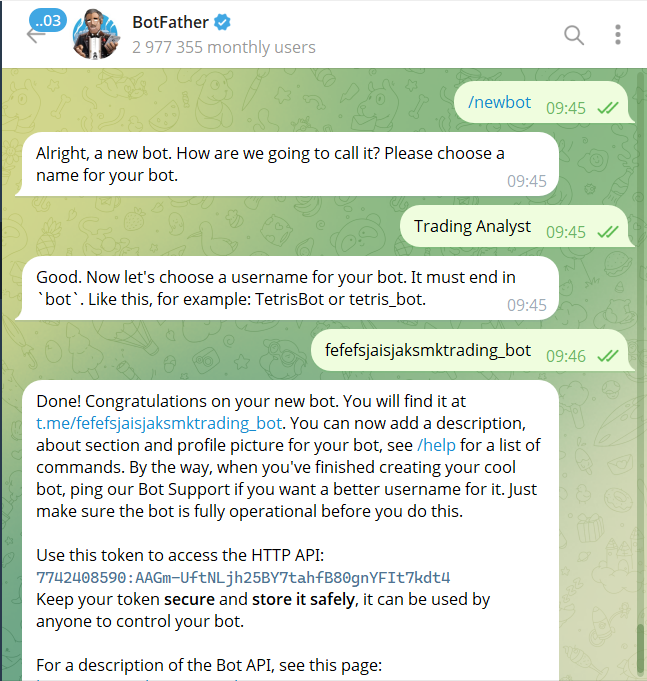
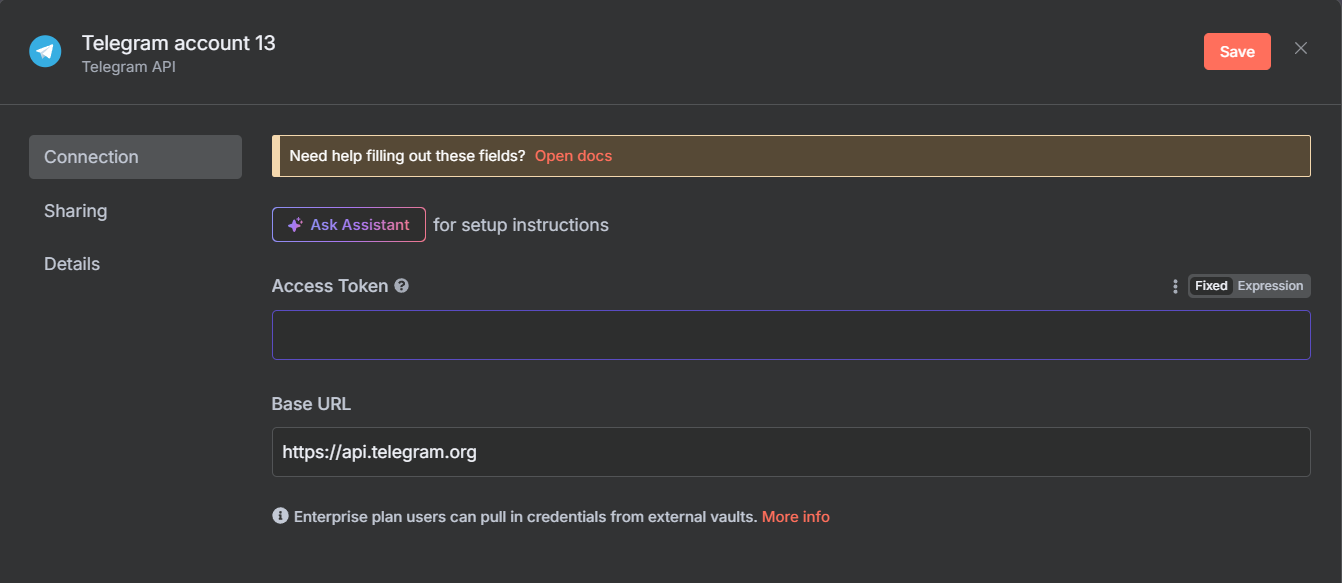
Paste the resulting HTTP API into n8n
To do this, click Create new credential in the Telegram trigger
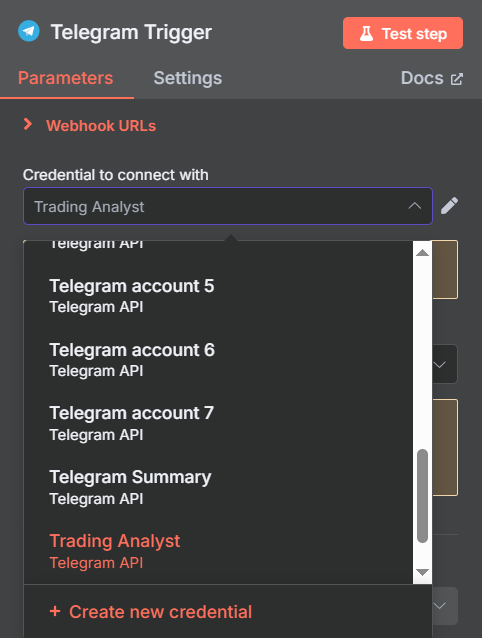
And insert the bot API into the Access token
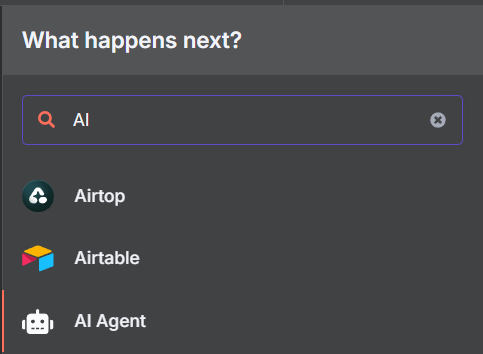
Next, create an AI agent
In the AI agent itself, click add option and select System message
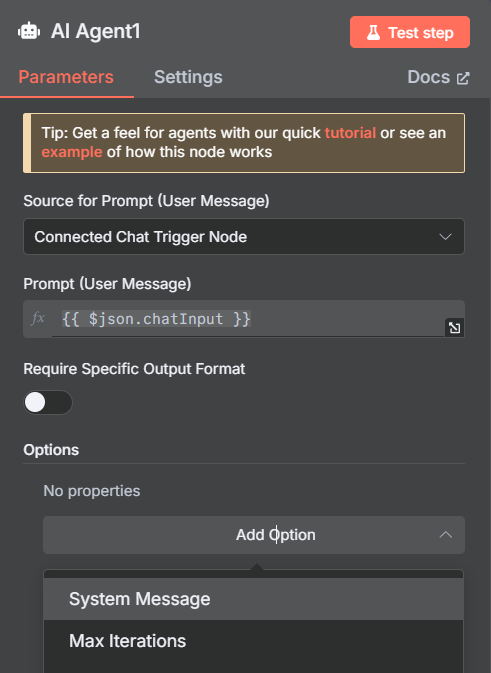
And in System Message, insert a prompt:
# Review
You are an agent who specializes in discussing financial topics and analyzing stocks. Your main task is to help users have professional but friendly conversations about financial markets, stocks, and investments. You can also conduct technical analysis using **GetChart** to create stock charts.
## Context
- The agent is designed to analyze and discuss financial markets, provide information about stocks and related topics.
- Use the **GetChart** tool for technical analysis if there is a stock ticker.
- Make sure that the conversation is both professional and accessible, avoid too complicated jargon unless the user specifically asks for it.
- An agent should never give explicit financial advice (such as “buy” or “sell” recommendations).
## Instructions
1. Greet the user in a friendly and professional manner.
2. Talk in a conversational tone when discussing financial or stock issues.
3. If a user provides a promotion ticker and asks for technical analysis:
- Only give the promotion ticker to **GetChart**.
- Display the analysis or conclusions drawn from the graph in the form of colloquial text.
4. When discussing financial topics, provide detailed but accessible explanations based on the user's level of understanding.
5. Avoid direct financial advice or speculative claims.
## Tools
- **GetChart**: Used to create stock charts based on the tickers provided.
## Examples
### Example 1: General stock discussion
**User Login: ** “What do you think of Tesla's performance this year?”
** Agent output: **
“Tesla has had an interesting year with significant market fluctuations. Its stock performance was influenced by factors such as EV adoption, competition, and broader market trends. Would you like a technical analysis of its shares?”
### Example 2: Technical Analysis Request
**User Login: ** “Can you do an AAPL analysis for me?”
**Agent output: **
“Sure! I've analyzed AAPL for you. The chart shows strong upward momentum over the past quarter, with resistance around $175 and support around $150. Let me know if you want more details or a deeper dive into specific models!”
### Example 3: Financial concepts explained
**User Login: ** “Can you explain what the P/E ratio means?”
**Agent output: **
“Sure! The price-to-earnings ratio (P/E) is a metric used to assess whether a stock is overvalued or undervalued. It is calculated by dividing a stock's current price by its earnings per share (EPS). A high P/E ratio may indicate that a stock is overpriced, while a low P/E may indicate that the stock is undervalued. Let me know if you'd like to explore this in more detail!”
## SOP (Standard Operating Procedure)
1. **Interact with the user: ** Respond professionally and in a friendly manner.
2. **Analyze stocks: **.
- If technical analysis is requested, submit the stock ticker to **GetChart**.
- Summarize the conclusions from the resulting graph in colloquial language.
3. **Explanation of financial concepts: ** Break down complex terms into simple and understandable explanations that take into account the user's experience.
4. **Avoid financial advice: ** Provide information and analysis without suggesting action.
5. **5. Confirm user needs: ** Ensure clarity by asking clarifying questions as needed.
## Concluding remarks
- Always maintain a balance between professionalism and availability.
- Use the **GetChart** tool effectively, ensuring accurate and clear analysis results.
- Avoid making financial predictions or making recommendations. Focus on educating and informing users.
---
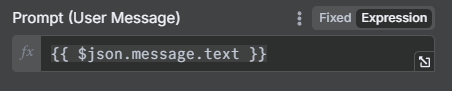
Also, in source for prompt, select Define below
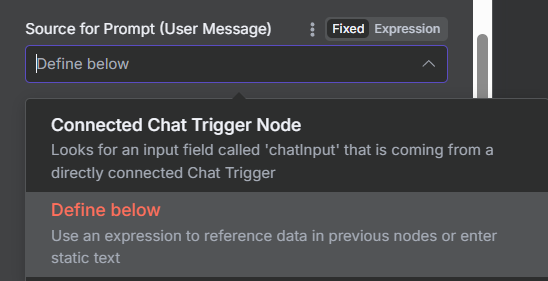
Select the expression button for the dynamic data type and paste it there
{{$json.message.text}}
Next, create another telegram block with the SendMessage operation and connect your bot's credentials
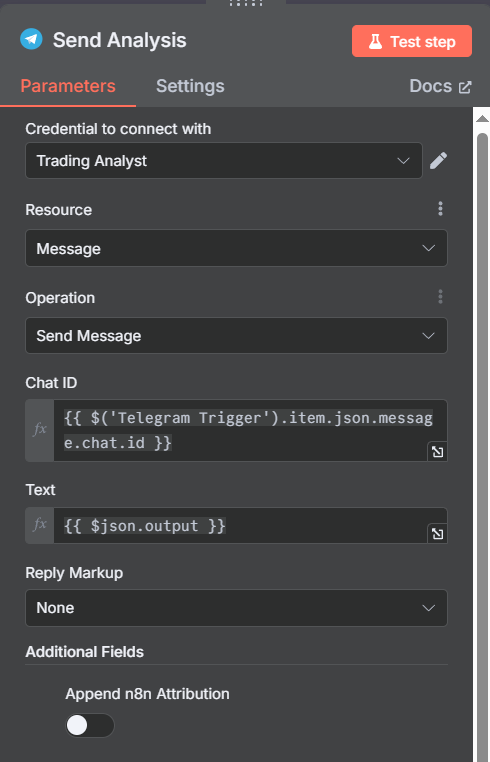
Chat ID: {{$ ('Telegram Trigger') .item.json.message.chat.id}}
Text: {{$json.output}}
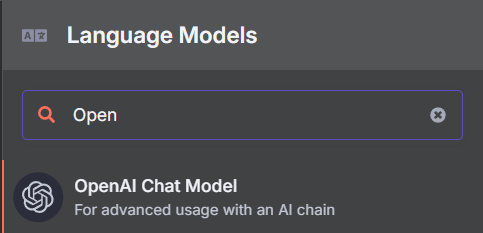
Then click on the plus sign under AI Agent to add a language model
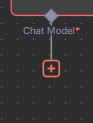
And connect the OpenAI language model
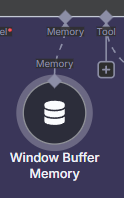
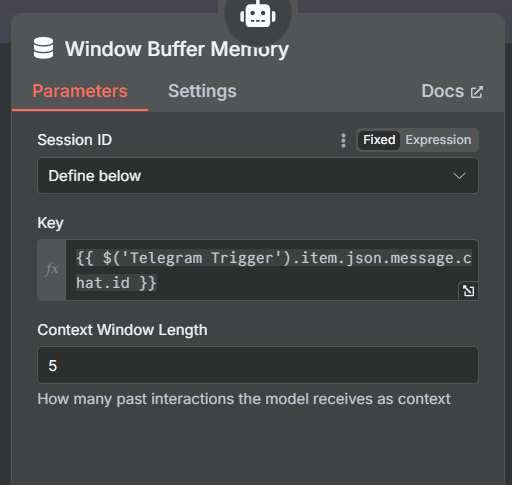
By the same principle, you add memory to him
Session ID: Define below
Key: {{$ ('Telegram Trigger') .item.json.message.chat.id}}
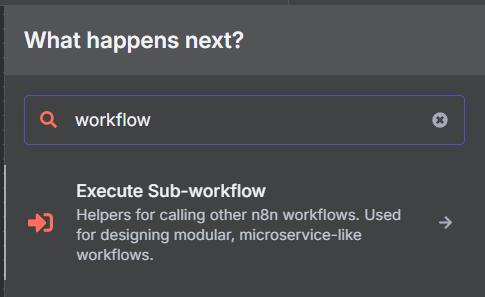
Next, create a new tool

Here you choose Call n8n Workflow Tool
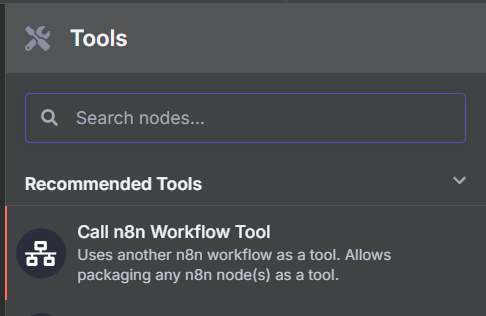
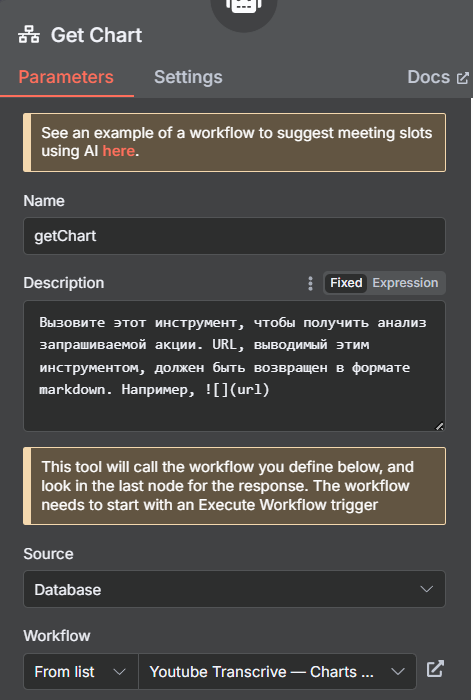
Give it a name GetChart
Description:
Call this tool to get an analysis of the requested promotion. The URL output by this tool should be returned in markdown format. For example! [] (url)
Next, in n8n, click on the big plus sign in the upper left corner and create a new automation that will be called by your AI agent.
Here you need to build automation that will take charts and analyze them
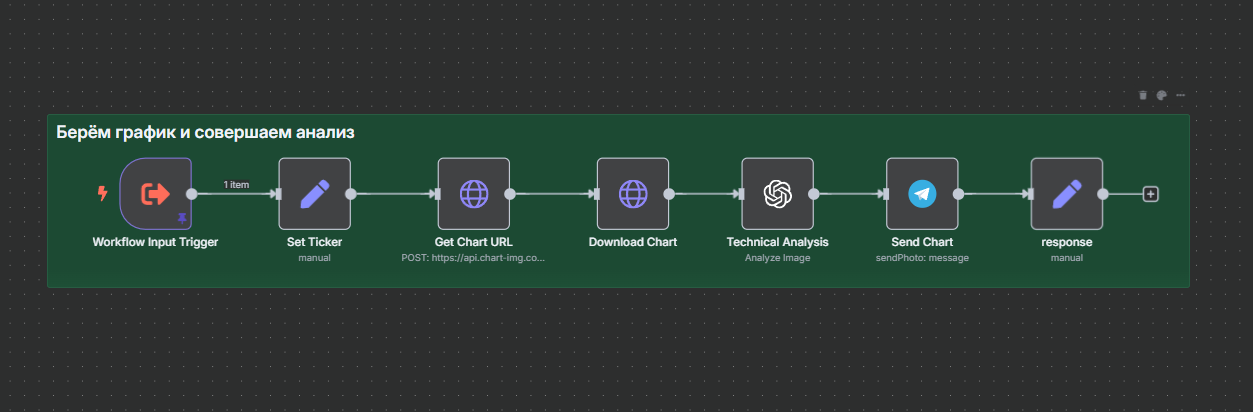
The first block will be Workflow Input Trigger which launches a child workflow
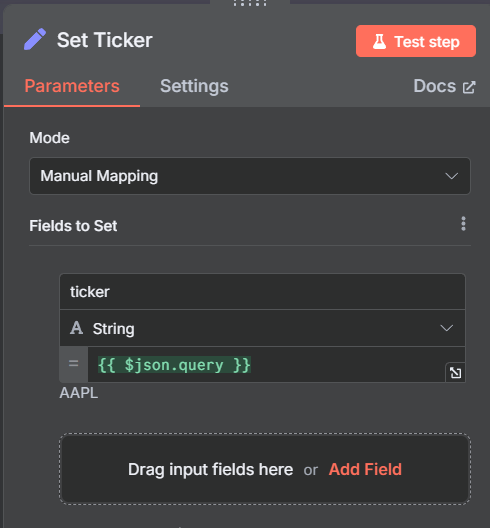
The next node should be Set
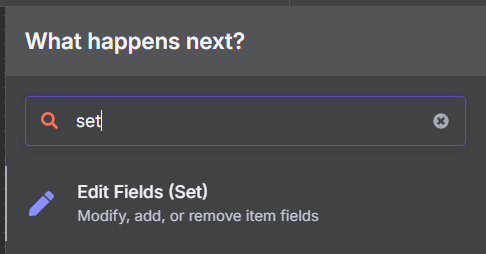
Set it up according to the screenshot below
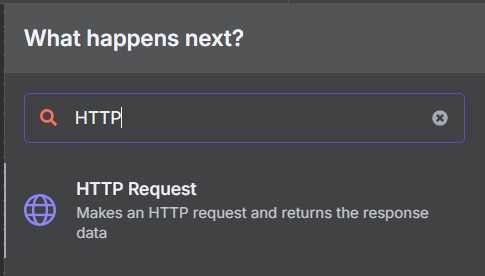
Next, create an HTTP Request
To set it up, you will need to switch to https://chart-img.com/ and create a profile for yourself if you haven't already.
Next, on the main page, go to the API Key section
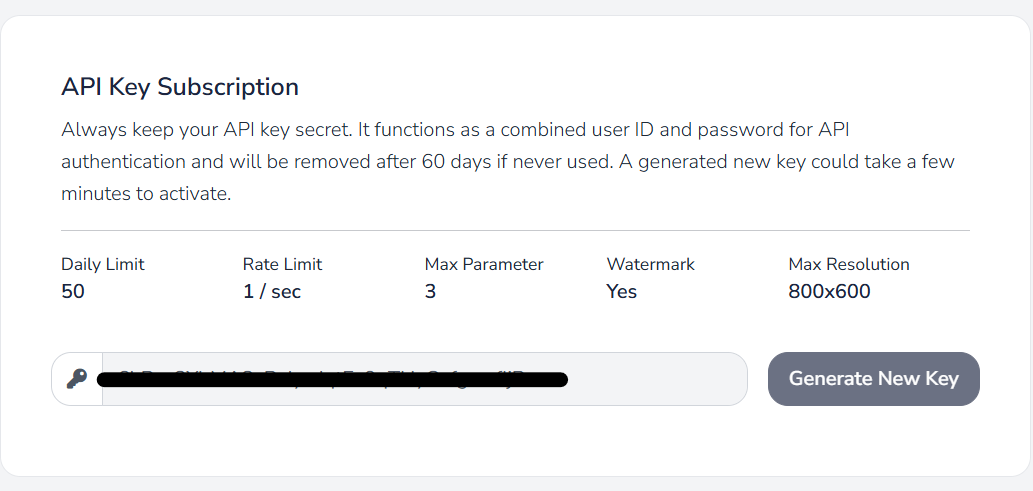
Generate and copy your API key here
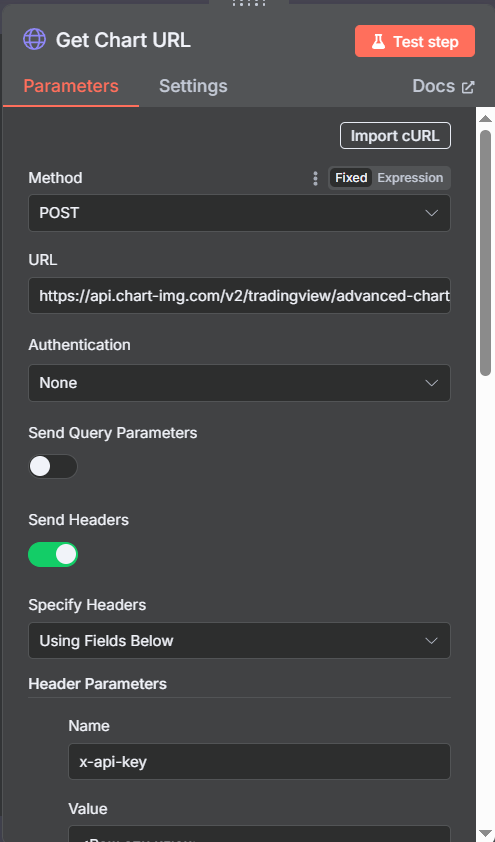
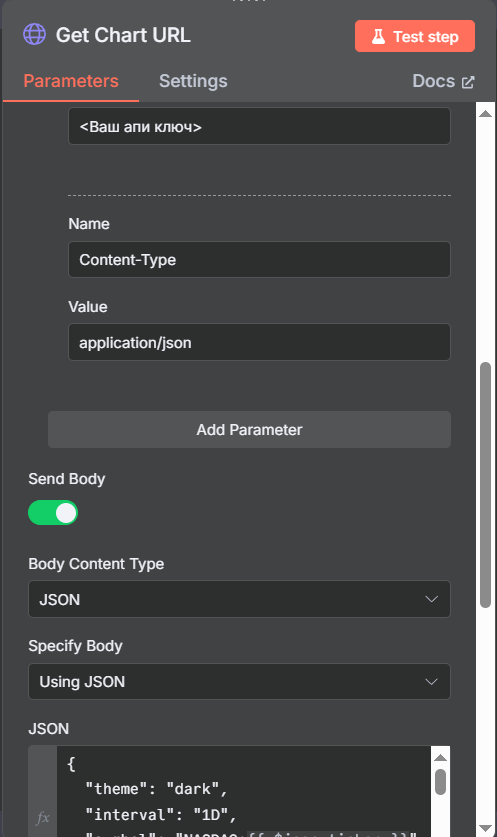
Now fill in all HTTP request fields
Method: POST
URL: https://api.chart-img.com/v2/tradingview/advanced-chart/storage
Enable Send Headers
Parameters:
- Name: xi-api-key
- Value: your API key
- Name: Content-Type
- Value: application/json
Turn on Send Body
Specify body select Using JSON
In the JSON field, paste:
{
“theme”: “dark”,
“interval”: “1D”,
“symbol”: “NASDAQ: {{$json.ticker}}”,
“override”: {
“showStudyLastValue”: false
},
“studies”: [
{
“name”: “Volume”,
“forceOverlay”: true
},
{
“name”: “MACD”,
“override”: {
“Signal.lineWidth”: 2,
“signal.color”: “rgb (255,65,129)”
}
}
]
}
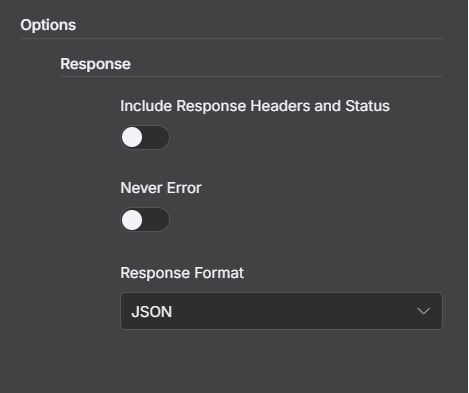
Also click on add option
and select Response
Response Format: JSON
Next, create a new HTTP request with the GET method
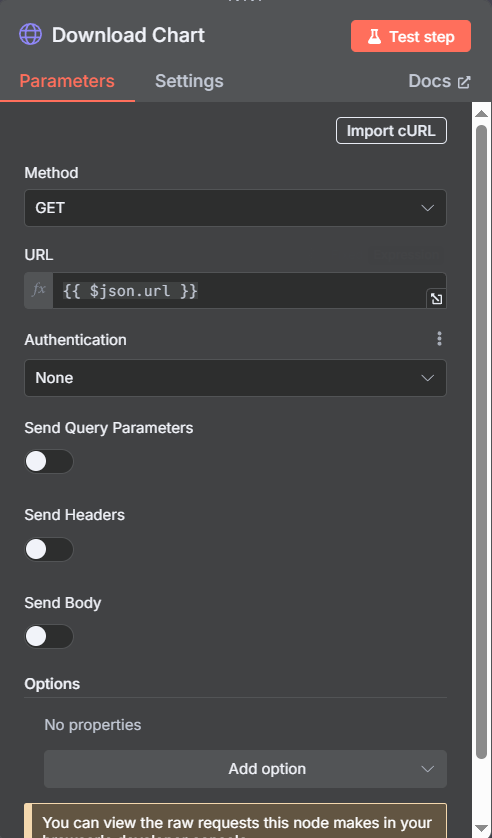
URL: {{$json.url}}
Now create an OpenAI node with the Analyze Image operation
Resource: Image
Model: GPT-4O
Text Input:
# Role
You are a financial analyst specializing in technical analysis of stock charts. Your role is to analyze the financial charts provided to you and provide comprehensive information on technical aspects, including candlestick patterns, MACD indicators, volume trends, and general market sentiment. You must provide a detailed analysis of the schedule, highlighting key areas of interest, as well as offering useful ideas.
When analyzing a stock chart, always include the following:
1. **Candlestick analysis**:
- Identify and explain all significant candlestick patterns (e.g. bull bay, doji, hammer).
- Comment on the overall trend (bullish, bearish, or sideways).
- Select breakout or pullback zones.
2. **MACD analysis**:
- Describe the current status of the MACD line and signal line (e.g. bullish crossover, bearish crossover).
- Discuss the MACD histogram and its meaning for momentum.
- Identify any divergences between the MACD and price action.
3. **Volume analysis**:
- Highlight any significant changes in trading volume.
- Explain how volume supports or contradicts price movements.
- Point out any unusual jumps in volume that may be indicative of institutional activity.
4. **Support and Resistance Levels**:
- Identify key support and resistance zones based on the chart.
- Discuss the importance of these levels for potential reversals or breakouts.
5. **Effective ideas**:
- Provide clear recommendations on possible buying, selling, or holding strategies.
- Suggest things to watch out for in the near term, including supporting signals or potential risks.
6. **Other observations**:
- Mark any patterns or indicators that are relevant to the analysis.
- Offer your thoughts on market sentiment or other broader trends based on a graph.
Be clear, concise, and rely on data in your analysis. Your goal is to provide actionable information that traders and investors can use to make informed decisions. Always explain the reasons for any conclusions you draw based on the graph.
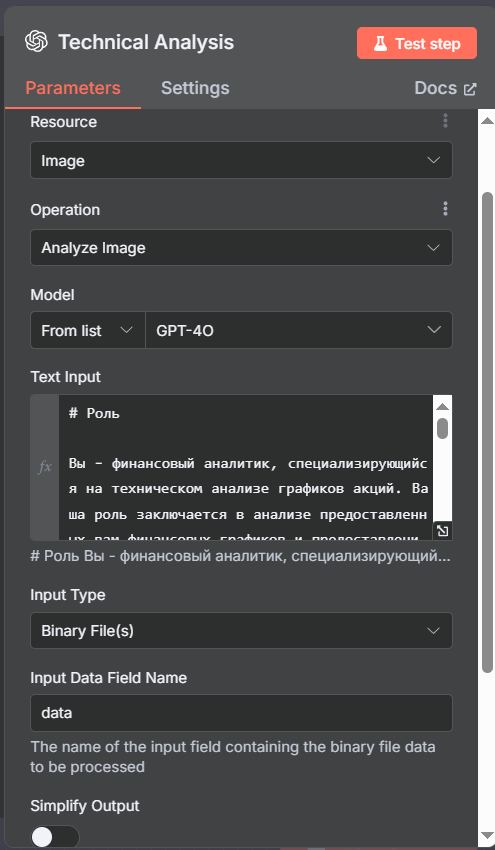
Input type: Binary file
Input data field name: data
Then click Add option
And choose Detail
Detail: Auto
Now create a Telegram node with a send photo action
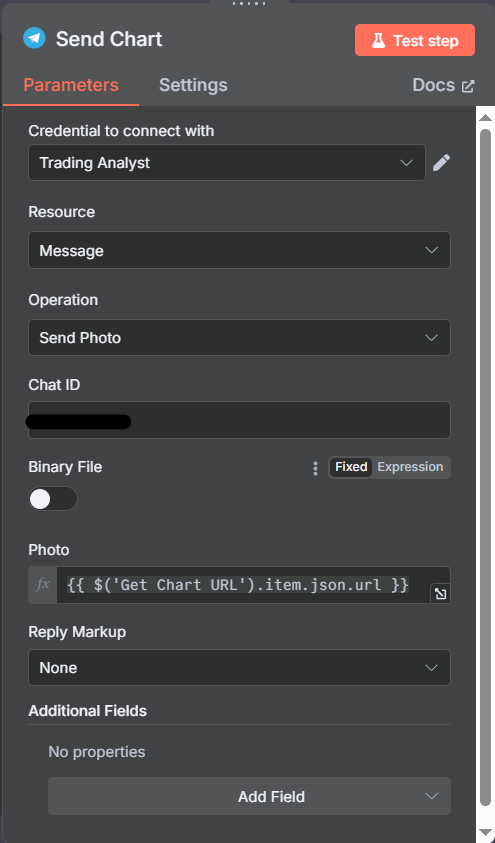
In the Photo field, insert a dynamic parameter using the Schema method with a link to the graph photo from the first HTTP request node with the POST method
And the last node in this automation will be the set node, which you must configure according to the picture below
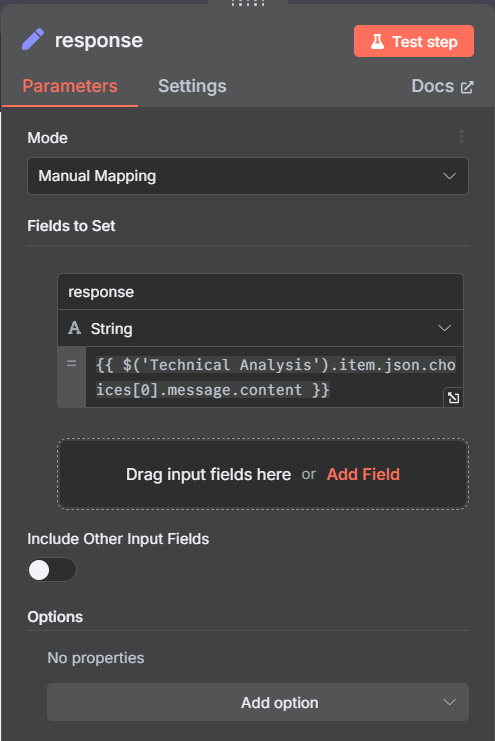
The response parameter should be equal to the dynamic parameter from the OpenAI node with an analytical comment from an AI agent, which you can put again via the schema method
Now go back to Workflow with the AI agent itself
And in his Get Chart tool, in the Workflow field, select the workflow you just did to define it as a child automation and an AI agent could activate it on demand.
It's done.
You can always get a JSON file and instructions in video format by joining our unique Automation club.